www.diploweb.com/english/1.htm Geopolitics of the European Union

The EU enlargement, what it will change ?  French

by Pierre Verluise,

Director of the seminar “Geopolitics of the European Union”

at the Collège Interarmées de Défense  (Paris)


To claim that the enlargement, from EU15 to EU27 and even more, “will not change a thing” does not resist the analyse of two fundamentals of geopolitics: population and economy. New's letter Editor

Traduit par Elisabeth Delhaisse

Key words: pierre verluise, geopolitics of the european union, enlargements 2004 and 2007, EU 15, EU 25, EU 27, cyprus, estonia, hungary, latvia, lituania, malta, poland, czech republic, slovakia, slovenia, bulgaria, rumania, territory surface, population, inhabitants, demography, natural increase, total increase, migrations, migrants, emigration, immigration, demographic dynamics, depopulation, ageing, taking up, economic activity, mafias, corruption, migrating policy of the UE EU, judicial co-operation between the UE countries, economic, gross domestic product 2002, 2003, GDP per capita,  2000 – 2006 UE programs, 2010 and 2015 adjustment forecasts, inheritance of the planned economy, transition, precariousness, inequalities, euro zone, buying power standards, UE budget, allowances, phare, ispa, sapard, UE negotiation ways, European Commission, UE financial prospects, cohesion policy.


How will the EU enlargement change the geopolitical fundamentals of the community area? Because "the richness lays in the men", this study deals with demographic dynamics and the production of wealth, via economic growth.

This means being aware of the evolutions induced by the EU enlargement to ten new countries on 1st May 2004 (Cyprus, Estonia, Hungary, Latvia, Lithuania, Malta, Poland, Czech Republic, Slovakia, Slovenia), and the membership of two other countries (Bulgaria, Rumania) by 2007. 

The membership of Bulgaria and Rumania for 2007 is to be considered with some precaution. Furthermore, the economic and demographic data used here are evidently anterior to May 1, 2004, one must be cautious in their use. These figures should be recalculated with the definitive data on January 1, 2005 and on the first day of the year following the Bulgarian and Rumanian entry. Finally, it will be important at one point to take into account the possible candidature of the Occidental Balkans, the process having started at the Thessalonic summit (June 2003). Croatia, Bosnia, Serbia-Montenegro, Macedonia and Albania must first westernise their political ways and liberalise their economy. Not to mention the Turkish candidature that is supported … by the United-States.  

The EU at 25, and then at 27, cannot be the same as the EU15. The demographic parameter is our first indicator here. As indicated in the graph 1, based on the population in millions on 1st January 2002, it is undeniable that the EU enlargement to ten and then to twelve new countries will increase the number of inhabitants in the community area.

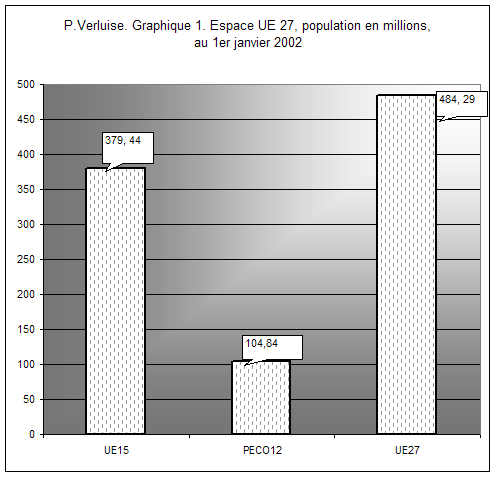
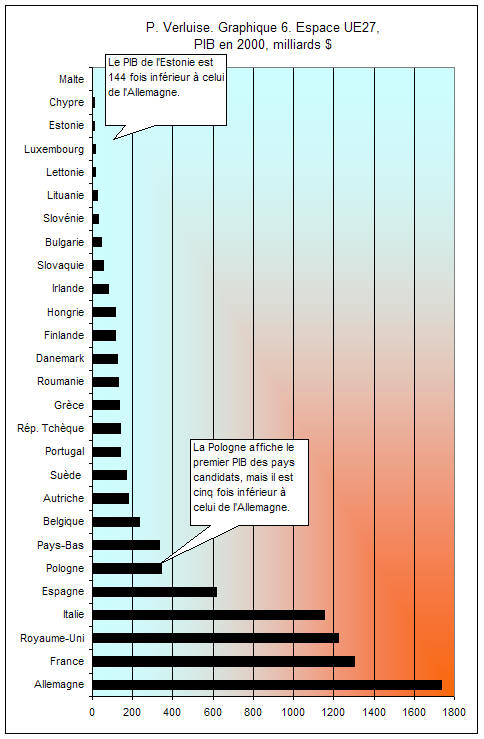
The passage from EU15 (379,4 million inhabitants) to EU27 (484,2 million inhabitants) represents, according to these figures, a gain of 104,8 million inhabitants. That is an increase of 27,6%. Compared to EU15, the community population would be multiplied by 1,28% with the enlargement to 27. The twelve new members would then represent 21,6% of the population of the enlarged European Union, that is a little more than one person out of five. The enlargement would move the EU gravity centre towards “Median Europe” because most of the candidates are situated in that direction. As Germany has a solid knowledge of the Mitteleuropa, it could be advantaged. Finally, enlarged to 27, the EU would count 1,7 times more consumers than the United States but their average purchasing power would not be the same.

A LARGER BUT MORE HETEROGENEOUS AREA AN INCREASE IN THE NUMBER OF LESS POPULATED COUNTRIES

The integration of these twelve countries would also induce a gain in the EU territory surface. It would grow from 3,2 million square kilometres (EU15) to 4,5 million square kilometres (EU27), that is a growth of 40,6%. The twelve new members would then represent 28,8% of the surface of the enlarged EU. 

The EU territory, which is now limited to 33,3% of the surface of the United States, would then represent 46,8% of its surface. The community territory would remain inferior to the half of the United States. Also, the territory planning of the oriental part of the EU27 can barely weigh in the balance. The improvement in infrastructures is a huge financial challenge that could allow EU27 to benefit truly from the gains in population and territory. 

The study of this data, on the EU15 scale or on the EU27 scale, should not stop us from making an analysis specific to each country. To start with, the sizes of their populations vary. If it is unwise to speak of  “big” and “small” countries, we are nevertheless forced to observe that the 27 countries are not equally populated, as it appears in the graph 2 “EU27 area, population in thousands on 1st January 2002.”

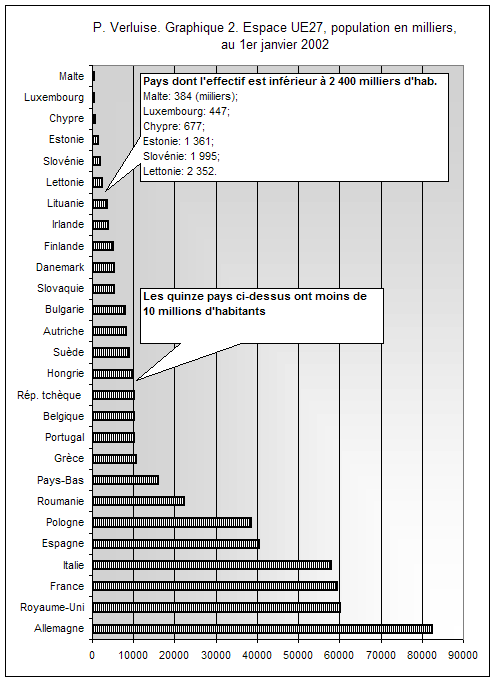
This graph shows that on 1st January 2002 not one candidate to the European Union has a population over 40 million inhabitants. For information, Germany, reunited since 1989-1990, is the most populated country in the community area with its 82,3 million inhabitants at the considered date. We can then say that not one candidate country has a population half as big as the population of the Federal Republic of Germany.


Poland is the most populated country among the candidates for the 1st May 2004 entry: 38,6 million inhabitants. It alone represents 52% of the population of the ten candidates for 2004. Rumania is the most populated country for 2007: 22,3 million inhabitants. The other countries of the first group of candidates all have less than 10,3 million inhabitants. Four of them count between 10,2 and 3 million inhabitants, we have by decreasing order: Czech Republic, Hungary, Slovakia, Lithuania. Finally, the rest of them count less than 2,4 million inhabitants, we have by decreasing order: Latvia, Slovenia, Estonia, Cyprus and Malta.


Therefore, the passage from EU15 to EU27 would mean that the number of countries poorly populated would increase. When EU15 has six countries with less than 10 million inhabitants, EU27 will have fifteen, that is a multiplication of 2,5. It is predictable that the countries that have recently gained their independence will be as eager as the other countries to speak their voices, after having obtained the most advantageous institutional compromise possible.  This of course will make it extremely difficult for the EU to speak one voice on the international scene, especially in matters of foreign affairs and defence.


WHAT DEMOGRAPHIC DYNAMICS ?


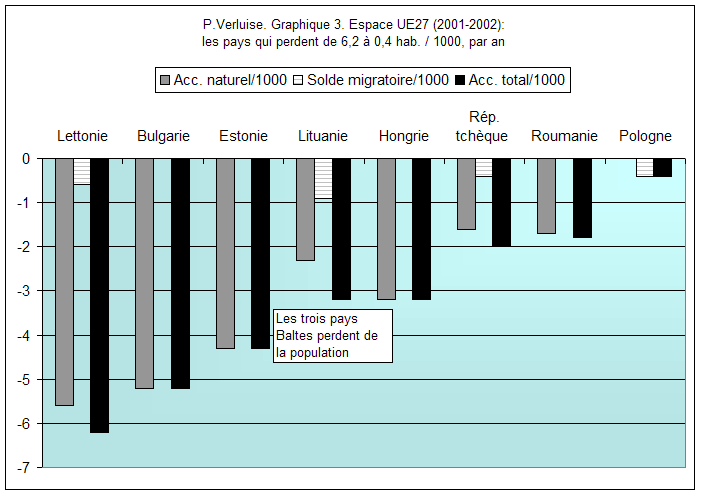
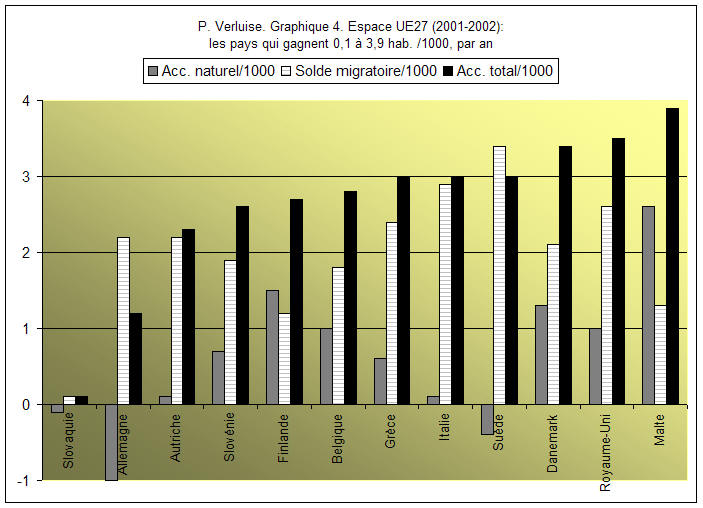
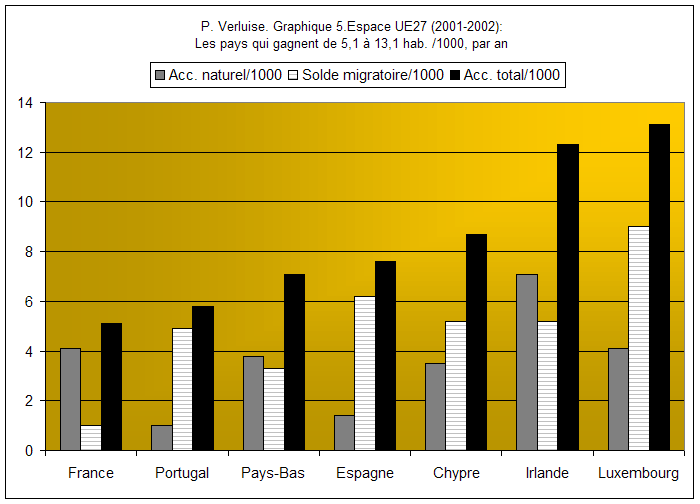
After having studied the basic data, one must look closer to the demographic dynamics of the members and candidates considering correlatively the natural increase, the migratory balance and the total increase. As it appears in the graphs 3, 4 and 5, the hierarchical classification of this data, regarding this last parameter, shows three groups.


The graph 3 presents all the countries that – from 1st January 2001 to 1st January 2002 – have lost between 6,2 and 0,4 inhabitant(s) for 1000 inhabitants. These countries are all, without any exception, candidates for 2004 or 2007.

  On line:    2004


DEPOPULATION


We are talking here about the following countries from Northern, Central and Oriental Europe: Latvia, Bulgaria, Estonia, Lithuania, Hungary, Czech Republic, Rumania and Poland. Jean-Joseph Boillot designs the first six as «near-pits of depression». Gérard-François Dumont even wrote, “the whole Ten (candidates for 2004) are going through a depopulation”. The situation in these countries is the result of the “transition” of the 1990s. These figures can be explained by the drop in fecundity, the downturn in life expectancy and the tendency to high net emigration flows. The demographer Alain Monnier had already sounded the alarm in 2000: “after the Fall of the Berlin Wall, the growth rate of the Eastern Europe population, which for twenty years had grown steadily around 0,7% each year, has passed from + 0,5% to – 0,5% a year in less than ten years, turning negative as early as 1993. Since then, Eastern Europe has most 8 million inhabitants.”


Only a strong immigration could limit these evolutions. Though immigration has progressed after the borders were opened, it stays generally moderated in these countries which are not as attractive as these seven other countries: Luxembourg, Spain, Ireland, Cyprus, Portugal, the Netherlands, France (cf. graph 5). 


THE ENLARGEMENT INDUCES A SLOWDOWN IN NATURAL RATE OF GROWTH


According to these figures, the enlargement seems to imply the integration of countries following a dynamic of depopulation. This will contribute to worsen the ageing of the EU and the consequent problems of retirement pensions and medical expenses. Furthermore, the reduction in the active population does not favour the creation of wealth. The demographic configuration of the new members will handicap them in their efforts to “catch up” with the EU15 countries. On the EU27 scale, this demographic configuration could have an influence on the demographic dynamics and the economic activity.


If we only consider the natural increase, leaving aside the migratory balance, the consequences of the enlargement on the EU demographic dynamics seem quite important. On the period of study (2001-2002), the EU15 natural increase is of 1,1 / 1000 inhabitants, whereas for the twelve other countries the figures fall to –1,5 / 1000 inhabitants. Therefore, one cannot affirm that the enlargement will bring an end to the well-known demographic problems in the EU. Actually, it looks like the enlargement will even induce a new aggravation of the EU demographic situation. Gérard-François Dumont, professor at the university of Paris-Sorbonne, foresees: “the European Union at 25 is then a regional organisation with a proportion of young population that could be even smaller than in EU15. That is if there is no regain in vitality, implying some significant changes in rules or behaviours, to inverse the evolution engaged.” The migratory balances of Bulgaria, Estonia, Hungary, Rumania and Poland are not mentioned on graph 3 because Eurostat estimates them at 0. This does not mean there is no emigration, but rather that immigration, especially from the ex-USSR, would be equivalent.   


CAUTION ON EMIGRATION FIGURES


One must be very careful using these kinds of figures. Indeed, Jean-Joseph Boillot wrote that: “According to the official figures from Eurostat, the total number of individuals coming from the countries in Central and Oriental Europe (in EU15) did not exceed 850 000 individuals in 1998, that is 0,2% of the EU15 population, and included 300 000 workers. This figure would not exceed 0,8% of the population originally from the countries in Central and Oriental Europe. When taking into account the informal emigration flows, these proportions could double, but the mechanisms in action here would not really change.” It is nevertheless quite stunning to know that the Eurostat figures on the emigration from the countries in Central and Oriental Europe to EU15 should in fact be doubled.


Poland, Krakow. Crédits: P. Verluise


Director of research at the French National Institute of Demographic Studies, Jean-Claude Chesnais draws our attention to the possible role of countries in Central and Oriental Europe in the post cold war European migratory system. “We have a great mixing of populations in Europe. This process is bound to continue. The countries that are about to enter the EU could benefit from this human and ethnical mix. It is already true for the Czech Republic. The living standards in the Czech Republic, even though they remain inferior to those in the countries of Western Europe, are still enviable to a large part of the planet, and are quite attractive. The country is efficient, well organised, capable of having some interstices in its economy like in services and particularly tourism. Poland also has some kind of appeal”.


STEPPING STONE TO MAFIA RINGS ?


The Mafia rings have many bases in the countries in Central and Oriental Europe. These networks are propelled from the Balkans, Russia, China…. The countries in Central and Oriental Europe could become hubs to the Mafia rings specialised in the smuggling of illegal emigrants within the European Union or at its borders.


It is possible that these foreigners settle down in the countries in Central and Oriental Europe to become EU members in 2004, or in candidate countries for 2007 like Rumania and Bulgaria. As corruption is still very present in the countries in Central and Oriental Europe, it makes things easier for illegal immigrants to be integrated. Poland would surely receive economic migrants from Byelorussia, Russia and Ukraine. 


THE PERPETUATION OF INCONSISTENCIES THAT HAVE … THEIR CONSISTENCY


The inconsistencies in terms of migration and judicial co-operation that remain today in the EU give way to the traffic of human beings. In fact, many actors are satisfied by the entry of low wage workers, often destined to work in the textile industry or in domesticity in the EU15 countries. Not to mention prostitution. This pushes some actors to overlook the criminal aspect of the traffic. Actually, criminals benefit the market. This can explain the perpetuation of some inconsistencies…that have their consistencies.


The graphs 4 and 5  picture, with a hierarchy, the “winners” in terms of total increase in the population. There are two distinct groups. The graph 4 regroups the countries showing a yearly increase of 0,1 to 3,9 inhabitants / 1000, which is quite moderate. The graph 5 presents countries with an increase of 5,1 to 13,1 inhabitants / 1000 each year, a significant increase.  


*


The graph 4 presents the twelve countries of EU27 that “win” 0,1 to 3,9 inhabitants / 1000 on the considered period. This group encloses the only two countries of Central and Oriental Europe that have a positive global increase. Slovenia shows a relatively favourable position (2,6 inhab./1000), not much for its natural rate of growth than for its migratory balance. It is not a surprise that Slovenia’s results and economic perspectives are then relatively enviable compared to other candidates. The results seem more fragile for Slovakia. The slightly positive total growth (0,1 inhab./1000) in Slovakia is due to its migratory balance as its natural rate of growth is negative.


Two EU15 countries, Germany and Sweden, do the same operation at another scale. Germany’s migratory balance (2,2 inhab./1000) allows the country to show a positive total growth (1,2 inhab./1000) though its natural rate of growth is in big deficit (- 1 inhab./1000). 


EU15 COUNTRIES CAN OPERATE AS “OPEN DOORS”


The graph 4 also shows the UE15 countries that operate as “open doors” to the community area, if ever this data is reliable. In decreasing order, the group encloses the following countries: Sweden, Italy, United-Kingdom, Greece, Denmark and Belgium. It is important to note that entrees from all geographic origins are considered here, not only those from candidate countries. The other exit zones must not be forgotten, and it is also true for the following graph.


The graph 5 points out the seven countries that have a significant gain, from 5,1 to 13,1 inhabitants /1000, between 1st January 2001 and 1st January 2002. This group encloses only one country candidate to the European Union: Cyprus. This Mediterranean island does not have a communist inheritance. Nevertheless, the post-soviet capital can sometimes benefit from banking facilities and thus contribute to the island’s economic activity and its appeal.


In decreasing order, the graph 5 presents the following seven countries as “open doors” to the EU27 area: at a same level of 5,2 inhab. /1000 we have Luxembourg, Spain, Ireland and Cyprus, and then the others Portugal, the Netherlands, France. In the Iberian area, the African contribution is probably very big, but we can already observe some Slav implementations.


According to these figures, France owes its total growth to its natural rate of growth rather than its migratory balance. Ireland is in a close position though its figures are higher. 


“LOSERS” AND “WINNERS”


The demographic approach of the EU enlargement reveals some contrasts, “losers” and “winners”. Will the economic approach contradict this observation ?


The assumption that “richness lays in men” is only true if these men produce. Thereupon, a comparative approach between countries of EU15 and between countries of EU27 underlines fundamental and even structural differences. The study is not exhaustive but addresses many indicators like the gross domestic product, the growth of the GDP in 2002, the GDP per capita, the community programs for the 2000-2006 period and previsions on the “catching-up” of the EU15 general level for years 2010 and 2015.


The graph 6 – EU27, GDP in 2000, billion of $ - expresses what table numbers can not easily put forward: the candidate countries, even the ones entering in May 2004, have GDP considerably inferior to those of most EU15 countries. Germany tops all the member States and the candidates with a GDP of  $ 1737 billion. 


SOME ENCOURAGING RESULTS


The most populated candidate, Poland, has the highest GDP among all the candidates but it remains five times inferior to Germany’s score. Estonia’s GDP is 144 times inferior to Germany’s (see map of the EU27 area, GDP per capita in PPS, EU15 = 100).


This is the result of four decades of a planned economy under the Soviet sway and the shocks induced by what was called the “transition”. It is generally not clear towards whom and for what purpose one or another country “transits”. The first half of the 1990s was very hard on the economic fabric of the post-communist countries. It was also very hard for huge portions of the populations who were confronted to great precariousness.


Candidate countries could advance that in year 2002 their GDP grew much faster than in the EU15 countries, as it appears on graph 7 – EU27 area, 2002 growth in % of GDP, for the twelve candidate countries + average of EU15 countries.

In 2002, all twelve candidate countries have a higher growth rate than the EU15 average rate (1%). The three Baltic candidates are even doing six times better. These results could contradict the reservations about the link between depopulation and the small production of wealth. However, we must picture the study in the long run. It is still interesting to note that Rumania and Bulgaria, restrained to wait for year 2007, do nearly as much as five times better than the EU15. Malta has the smaller growth rate (1,2%) but was able to inverse the 2001 negative tendency. There are reasons to be optimistic, and for the community institutions to praise the virtue of their advice and the benefit of the distributed subsidies.


Nevertheless, the 2002 average for the ten candidates to enter 1st May 2004 is, according to Eurostat,  “only” 2,4%. Even Poland, the most populated candidate, has a GDP growth of “only” 1,6%.


NOT HALF OF THE EU15 LEVEL


Let us first define the Purchasing Power Standards. Jean-Joseph Boillot explains: “we call catch-up or convergence the economic process that will help a country or a group of countries economically backward join more advanced countries through mechanisms of pulling from strong to weak. The classic measure is one of the levels of gross domestic product (GDP) per capita, expressed in a comparable currency and especially in prices comparable in intrinsic value (bread is worth bread…), what the economists call the exchange rate in purchasing power parity (PPP) or in purchasing power standard (the PPS is used for a comparison with the average prices in the European Union). We define a ratio of the average GDP per capita in the EU and the GDP per capita of the backward countries. We then follow the trajectory of this indicator through a long period of time). There is convergence when the ratio of GDP per capita is close to the unit”. This definition is very clear even though the concept of “backwardness” can certainly offence some countries or even induce some kind of determinism.


We can now observe the graph 8. In 2002, the average GDP per capita for the 2004 candidates, expressed in purchasing power standards percentage, is not even the half of the EU15 level (47%).


Only two countries go over the 70% : Slovenia (74%) and Cyprus (73%), as the island does not share the communist inheritance and the “transition” problems. Only two countries have results between 60 and 57% : the Czech Republic and Hungary. These four countries are relatively less populated.


Rumania. Credits: European Union 


Poland, with 38,6 million inhabitants, is the most populated candidate country but barely stands at 40% of SPP in reference to the EU15. At Poland’s northern border, the three Baltic countries have more or less the same figures (Estonia: 42%, Lithuania: 39%, Latvia: 35%). With a GDP per capita, expressed in Standard Purchasing Power, a little over the 1/3 of the average for EU15, Latvia is at the end of the line of candidate countries for 2004. This graph explains why the entry of Rumania and Bulgaria (25%) was scheduled for later. It has been settled, in compensation, that these two countries will benefit from financial assistance programs to ameliorate their status. This decision weighs and will continue to weigh on the community budget.


By the way, which countries already benefit from the biggest allocations?


LITTLE EUROPEAN GAMES


The graph 9 presents indicative allocations of community programs for candidate countries.


These figures suggest a battle of wills between the candidates and the members, and the worries of the decision-makers.  Poland, the most populated and the candidate with a SPP in reference to the EU15 inferior to the 2004 candidates average (in 2002), benefits from the biggest budget. The two countries to become members in 2007 come next. Finally, the less populated countries get smaller budgets.


Director of Research at the Centre d’Etudes et de Recherches Internationales (Centre for Studies and International Researches), Jacques Rupnik makes the following commentary: “ In the agenda 2000, an amount of money has been provided for in the perspective of the enlargement. J.Chirac and G.Schröder agreed to reduce this amount, already limited, of a billion euros. It is the intervention of a small-timer hoping to save money and save the Commune Agricultural Politic. J.Chirac helped G.Schröder come out from his isolation after his victory in elections on anti-Americanism. The German Chancellor was at that time totally isolated. He accepts the French President’s move and adheres to the principle: “We do not touch to the CAP until the next budget and we try together to give short measure to the budget dedicated to the enlargement”. When in December 2002 the candidate countries arrived at the Copenhagen summit, they were not only mad with the initial amount that they already found insufficient, they were scandalised by its reduction. At that point the candidate countries started bargaining. The result was not an increase in the total volume allocated to the enlargement but a simple reallocation of the resources. The resources will be directly accessible to the Polish Budget instead of being part of a project. This system is much more advantageous for the government, yet maybe less favourable to the reforms that are needed. Fundamentally, the amount of money stays the same, only the distribution mode changes. The worst about all this is that it reveals how much the candidates, especially Poland, identify the EU essentially as an economic body and not as a political body. It also reveals how much the candidates have appropriated what they believe is the political culture of the European Union: we assist to summits to go at it hammer and tongs, and end at four in the morning claiming victory!”.


This is manifestly what the candidate countries have learned from the European construction because we have been offering them this exhibition for years. They adopted this idea: each one fights for its interests, then everyone says “I win!”.


It remains to be seen what happens to the structural funds. Jean-Claude Chesnais wonders: “Will the use of these funds be active, attractive, and thus positive for growth? Or will it contribute to reinforce the reflexes of assistance?”.


NOT TO SOUND UNPLEASANT


As you may recall, the Polish and Rumanian authorities were summoned to reimburse big community sums during summer 2002 because they had been misappropriated…. It is true that Rumania and Poland are ranked respectfully 83 and 64 in the 2003 world ranking of corruption es by Transparency International. The higher the , the more aggravated the corruption. Not to mention that these two countries are closing behind the other candidates studied here.


The European Commission is aware of this problem. In the reports made public on 5th November 2003, the Commission draws attention to the corruption rates that are high, even very high for some candidate countries. These figures pose the question of the quality of public administration and the risk of misappropriation of community funds. These behaviours rarely benefit the honest and democratic people…corruption and democracy do not get on very well. If we are not careful, community funds could consolidate non-democratic forces. This would be an odd irony in History. We could imagine the following scenario: a Mafia, enriched by the misappropriation of European funds, wins a politic over by financing his electoral campaign. The Mafia then has even better access to the sensible information, allowing it to consolidate its hold.


The EU15 taxpayers will probably see these community programs of assistance differently than the citizens of countries from Northern, Central and Oriental Europe. These last ones are already critical of the programs’ modest amounts of money and of their use.


FORECASTS FOR YEARS 2010 AND 2015


According to the forecasts of the Wiener Institut für Internationale Wirtschaft (Institute of International Economy in Vienna) indicated in graph 10, these programs of assistance could weigh on the community budget for about two decades.


It is important to note that the “catching-up” forecasts in years 2010 and 2015 for the countries of Central and Oriental Europe are only suppositions. Though the exercise is useful, the results intricately depend on the starting hypothesis, for candidates and EU15 countries, and on the hopes and fears of the prospecting team at work, inevitably subjective. The future can prepare both the best and the worst “surprises”.


Nevertheless, at the 2015 horizon, that is more than ten years after the 2004 candidates adhere, only two out of the eight post-communist countries could go beyond the 75% of the EU15 GDP/inhab. The two countries would be Slovenia (1,9 million inhabitants in 2002) and the Czech Republic (10,2 million inhabitants in 2002), thus a total population of scarcely 12 million inhabitants according to the figures for 2002. This is about the global population of Paris, Lyon and Marseille. We must however keep in mind that the graph 1 indicates a total population of over 104 million inhabitants for the twelve candidate countries. In other words, the 7/8th of the population of the candidate countries would remain far below the 75% of the EU15 GDP/inhab. in 2015. The six countries concerned here could therefore hope for, and even require, diverse community assistance.


It seems that the most populated candidate, Poland (38,6 million inhabitants in 2002), could only reach 54% of the EU15 GDP/inhab. in 2015.  How many years will it take to approach the threshold of 75% ? Nobody knows for sure. According to the Wiener Institut für Internationale Witschaft, Lithuania and Latvia could not reach the 40% of the EU15 GDP/inhab. Rumania would be at 35% and Bulgaria at 33% of the EU15 GDP/inhab. There is at least one strong probability: the diverse community assistance will weigh on the community budget way over 2020. It seems therefore questionable to assert that the enlargement can take place with a constant budget.

 
SYMPATHETIC YET QUESTIONABLE CALCULATIONS


The first studies on the next financial prospects of the enlarged Union (2007-2013) set the future of the political cohesion at the centre of the debate. By political cohesion we must understand structural funds, cohesion funds and the pre-adhesion programs. The European Councils in Edinburg (1992) and Berlin (1999) did implicitly fix a ceiling for the expenses in cohesion at 0,45% of the European GDP. Yet, an official publication of the Ministry for Economy, Finances and the Industry reads: “Is this ceiling, which has not been reached at this time, still pertinent when the gaps of development between countries of the enlarged Union will considerably increase with the enlargement?»


Anyway, the general tone sounds reassuring. However, in “L’Union Européenne élargie. Un défi économique pour tous. (The enlarged EU. An economic challenge for all), Jean-Joseph Boillot admits that the economic benefits of the enlargement will be unequally distributed, to the advantage of the new members.


“The simulations indicate that the entry of the ten candidate countries will push their annual growth up 3% in a normal regime, 4% in the central scenario and 4,8% in the optimistic scenario from year 2005 on. The global gain in the decade (2001-2010) would represent some additional 10 to 18 points in the GDP, depending on the scenario. The macroeconomic gain is of course much smaller for the EU15 because the countries of Central and Oriental Europe count for only 4 or 5 % of its GDP. Overall, in the decade (2001-2010), the gain would not exceed an additional 0,5 to 0,7 point in the GDP, that is scarcely +0,1% a year when an annual growth around 2 to 2,5% was predicted. Then the costs of enlargement also seem rather low. The Commission has not precisely given figures in its 2001 study because the negotiations were not over, but the WIFO study estimates these costs at 190 billion euros for the decade or 0,15% of the EU15 GDP, a fraction of the global gain in growth.” (pp34-35)


Of course these hypotheses serve the demonstration. To start with: 0,10 % of GDP -  0,15% of GDP = - 0,05% of GDP. And besides, what is the credibility of hypotheses based on infinitely small figures collected over a whole decade? The hypotheses on the “forecasted annual growth” of EU15 (2 to 2,5%) must be considered with caution. We must keep in mind that the EU15 GDP growth fell from 1,6% to 1% between 2001 and 2002. Furthermore, all EU15 countries are not that well off. Germany seems to benefit more from the enlargement than France.  


YES, BUT…


If nothing is written, we should avoid nourishing illusions. The candidate countries do not intend being “second class” members in the community institutions. A diplomat from a candidate country reckoned, under cover: “We are convinced Europeans, we want to take part to the European Union, but are not satisfied with the economic conditions. Consequently, we are not that enthusiastic. On the principle, Yes, in practice…The negotiations dashed us. Poland managed to obtain a billion euros three days before the Copenhagen summit (2002), which forced our admiration but also made us a little jealous. The Polish spoke the state of mind of its population. We want Europe but not at all costs. Some executives told me: “if we are to become a buying market to the occidental economy, stop! Will we have to close down our industries to become a consumer market? We want to produce and export too! The concessions must not be one way!” Nevertheless, we are going to finalise the adhesion process because we have suffered too much in the past and have learned to resign. We are going to protest, and we are going to try and obtain a little more. We have accepted too much sacrifices to make things work, but we remain very cautious about their consequences on our day to day lives, we want more time. One must understand that these populations are still traumatised. Things should go on smoothly with these countries or they could react.”


The bitter failure of the European summit in Brussels on 13 December 2003 is proof here. To claim that the enlargement, from EU15 to EU27 and even more, “will not change a thing” does not resist the analyse of two fundamentals of geopolitics: population and economy. We would have thought that our democratic and pluralist society would have initiated a true debate -asserted, serene and respectful of others - on this subject. The strategy adopted to prevent this debate in the EU15 countries could, like a boomerang, have effects on the medium and long run … unpredictable.


Pierre Verluise


Director of the seminar “Geopolitics of the European Union” at the Collège Interarmées de Défense, Pierre Verluise is also in charge of geopolitics classes in the Institut Catholique de Paris (Institut Supérieur d’Interprétation et de Traduction). He created diploweb.com, a website recommended by the ENA (top school of Administration), the Commandment of the Enseignement militaire supérieur doctrine (military studies) and NYU.


Manuscrit clos le 28  décembre 2003.


Notes:  

Jean-Joseph Boillot

Author of an excellent work of synthesis titled “L’Union Européenne élargie. Un défi économique pour tous.” (The enlarged European Union. An economic challenge for all.), published at la Documentation Française, March 2003.


Gérard-François Dumont

Le cinquième élargissement démographique de l’Union Européenne” (The fifth demographic enlargement of the European Union), in Population & Avenir n°661, January-Febuary, p 4-8.


Alain Monnier

La population de l’Europe : 1950-2050” (Europe’s population : 1950-2050), Populations et Sociétés n°353, January 2000.


EUROSTAT

Statisics Office of the European Communities, founded in 1953 and based in Luxembourg.


Jean-Claude Chesnais

Démographie: l’Est ne sauvera pas l’Europe” (Demography : The East will not save Europe), Sociétal n°41, 3rd trimester 2003, p104.


Corruption

Read on this subject an article by Daniel Lebègue, president of the France section of Transparency International, published in La Quinzaine Européenne, November 2003, p12 : “La lutte contre la corruption est un travail de Sisyphe” (The fight against corruption is a work for Sisyphe)


To read …

The interview of Jean-Claude Chesnais with Pierre Verluise : “Géopolitique de l’Eurasie : le point de vue du démographe” (Eurasian geopolitics : the demographer’s point of view), April 2003. www.diploweb.com/p5chesnais1.htm


To know more about PPP and SPP…

Eurostat : “Comment sont calculés les PPA et qu’appelle-t-on SPA?” (How are the PPP calculated and what are SPP ?) methodological note in Statistiques en Bref, Thème 2 – 20/2003. Prix et parités du pouvoir d’achat.


To read …

Jacques Rupnik, Géopolitique de l’Europe Centrale : quels passifs ?” (Geopolitics of Central Europe: what history ?), interview with Pierre Verluise, September 2003, www.diploweb.com/forum/rupnik.htm


Compared corruption

Here is the rating of the other European countries : Slovakia 59th in the world rank, Latvia 57th, Czech Republic and Bulgaria 54th, Lithuania 41st, Hungary 40th, Estonia 33rd, Slovenia 29th, Cyprus 27th. Among the EU15 countries, Greece is the worst ranking 50th; Italy is the worst of the most populated countries at rank 35. France is at rank 23, behind Germany (16th) and the United Kingdom (11th). Finland, member of the EU15 since 1995, is number one.


References


MINEFI-DREE/TRESOR, Revue Elargissement, n°52, October 13, 2003, p.2.


Fritz Breuss, “Macroeconomics, Effects of EU Enlargement for Old and New Members”, Wifo Working Paper, 143/2001.


Also to read …


Stephan Martens, “L’Allemagne, l’Autriche et l’espace centre-européen” (Germany, Austria and the Centre-European area), PPS n°850, Documentation Française, January 2001, 84 pages.


Populations et migrations. CEI, Russie, Europe Centrale et Sud-Est” (Populations and migrations. CIE, Russia, Central and Southeast Europe). Le courrier des pays de l’Est, n°1035, May 2003, Documentation Française. Read the article by Jean-Paul Sardon “Europe Centrale, des trajectoires démographiques inquiétantes” (Central Europe, disturbing demographic paths), pp 27-42.


Graphs

All graphs are by Pierre Verluise, based on the following sources : Eurostat, Agenda 2000 and European Commission, WIIW,  and “l’Union Européenne élargie. Un défi économique pour tous.”, Jean-Joseph Boillot, Documentation Française.

Copyright 28 décembre 2003-Verluise / www.diploweb.com

L'adresse URL de cette page est www.diploweb.com/forum/verluise11english.htm


Table des graphiques, avec leur source.


1.      Espace UE 27, population en millions, au 1er janvier 2002. Source : Eurostat, « Statistiques en bref ». Thème 3 – 19/2001. Cité in Boillot, Jean-Joseph, « L’Union européenne élargie. Un défi économique pour tous », Paris, documentation Française, 2003, page 139. 

2.      Espace UE27, population en milliers, au 1er janvier 2002. Source : Eurostat, « Statistiques en bref ». Thème 3 – 19/2001. Cité in Boillot (2003).

3.      Espace UE27 (2001-2002): les pays qui perdent de 6,2 à 0,4 hab. / 1000, par an. Source : Eurostat, « Statistiques en bref ». Thème 3 – 19/2001. Cité in Boillot (2003).

4.      Espace UE27 (2001-2002): les pays qui gagnent 0,1 à 3,9 hab. /1000, par an.   Source : Eurostat, « Statistiques en bref ». Thème 3 – 19/2001. Cité in Boillot (2003).

5.      Espace UE27 (2001-2002) Les pays qui gagnent de 5,1 à 13,1 hab. /1000, par an. Source : Eurostat, « Statistiques en bref ». Thème 3 – 19/2001. Cité in Boillot (2003).

6.      Espace UE27, Pib en 2000, milliards $. Source : Boillot, (2003), page 19, d’après divers documents de la Commission européenne.

7.      Espace UE27, croissance en % du PIB en 2002, pour les 12 pays candidats + moyenne UE15. Source: Eurostat, « Statistiques en bref ». Thème 2 - 47/2003, page 2.

8.      Graphique 8. PIB par tête (2002) des pays candidats, en % de standards de pouvoir d'achat (UE15 = 100). Source: Eurostat, « Statistiques en bref », Thème 2 - 47/2003, page 7. Voir aussi « Statistiques en bref ». Thème 2,  32/2002 et 20/2003 pour plus d’informations sur la compilation des PPA et les limitations à l’interprétation des chiffres en SPA.

9.      Programmes communautaires (Phare, Ispa, Sapard), allocations indicatives maximales et minimales pour 2000-2006 (millions d'euros). Sources : Agenda 2000 et Commission européenne. D’après, J.-J. Boillot, (2003), p. 28.

10.  Pib/hab. (UE15=100), prévisions de rattrapage PECO pour 2010 et 2015, selon WIIW (2002), Boillot, (2003), p. 36.


  Recherche par sujet   Write : P. Verluise ISIT 12 rue Cassette 75006 Paris France

Copyright 28 décembre 2003-Verluise /www.diploweb.com

La reproduction des documents mis en ligne sur le site www.diploweb.com est suspendue à deux conditions:

- un accord préalable écrit de l'auteur;

- la citation impérative de la date de la mise en ligne initiale, du nom de famille de l'auteur et du site www.diploweb.com .

Pour tous renseignements, écrire : P. Verluise ISIT 12 rue Cassette 75006 Paris France